1 / 1
Category: Slides & Infographics
Description:
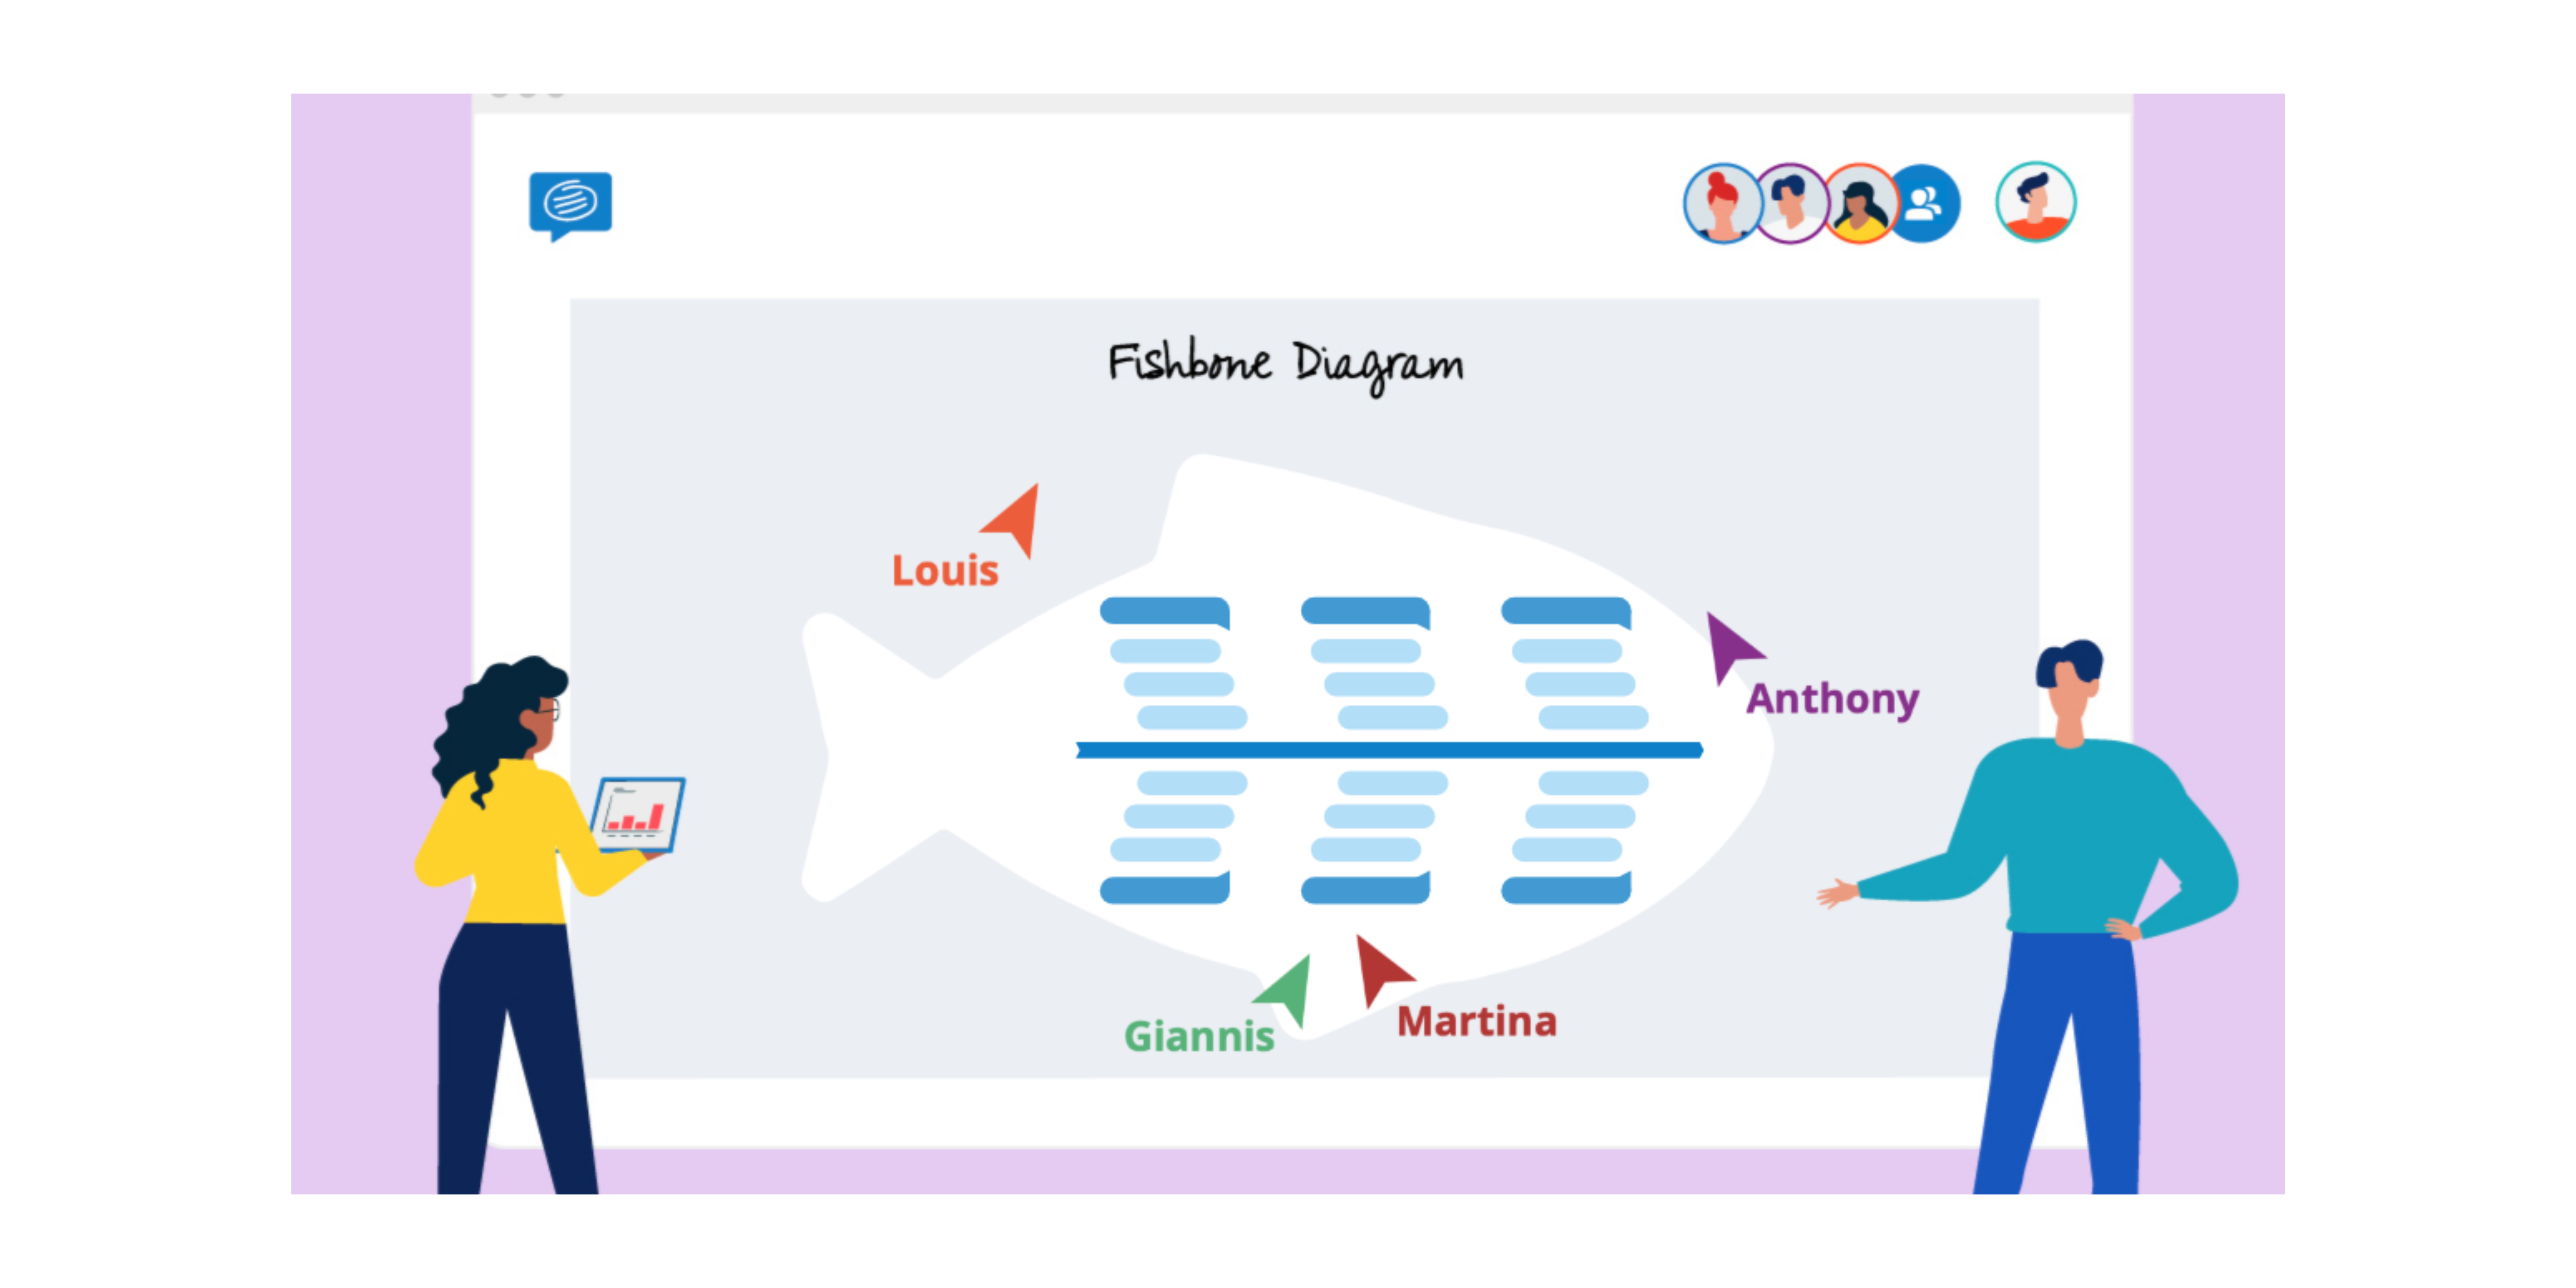
A fishbone diagram, also known as an Ishikawa diagram or cause-and-effect diagram, is a tool used in root cause analysis to identify the underlying reasons for a problem or issue. The diagram is structured like a fish skeleton, with the problem or issue being investigated placed at the head of the fish and the potential causes branching off like the bones of the fish.
The importance of using a fishbone diagram for root cause analysis is that it helps to organize and visualize the potential causes of a problem or issue, making it easier to identify the root cause. By breaking down the problem into its various components and identifying the factors that contribute to it, the diagram can help to uncover underlying issues that may have been overlooked or misunderstood.
Fishbone diagrams can be used in a variety of settings, from manufacturing and engineering to healthcare and business. They are a valuable tool for problem-solving and decision-making, enabling individuals and teams to identify and address the root cause of a problem rather than just treating its symptoms. Overall, the fishbone diagram is an essential tool for any organization or individual looking to improve their problem-solving skills and identify the underlying causes of issues they may encounter.