Category: Slides & Infographics
Description:
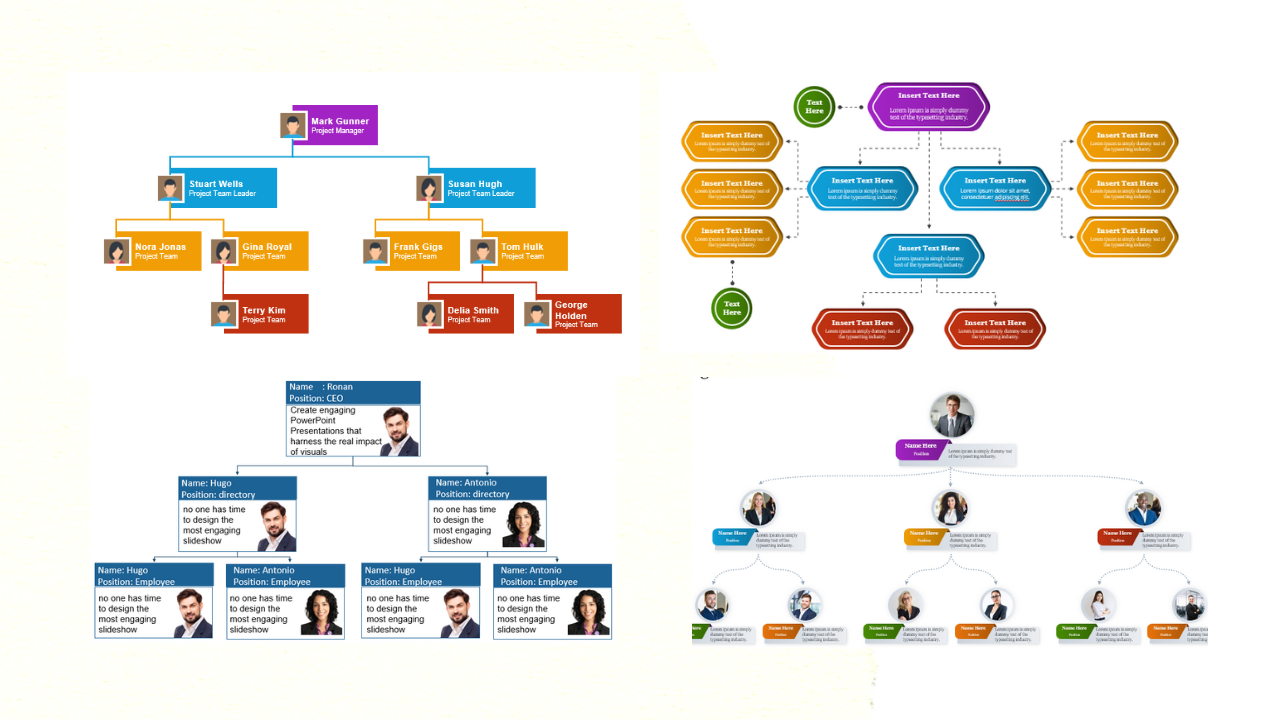
Chart organization is essential in effectively conveying information to an audience. Whether you're presenting data to a group of coworkers, creating a marketing report for clients, or simply displaying information on a website, the way you organize your charts can greatly impact their effectiveness. Good chart organization allows your audience to easily understand the data you're presenting, identify patterns, and draw conclusions. It involves selecting the right type of chart for your data, organizing the data in a clear and logical manner, using appropriate labels and titles, and formatting the chart to be visually appealing. By taking the time to organize your charts effectively, you can ensure that your message is conveyed accurately and efficiently, and that your audience is engaged and informed.